Improving LoRa Reception - Part 2
In Part1;
https://stuartsprojects.github.io/2024/07/23/Improving-LoRa-Reception.html
The AB-IOT-433 was tested in an open field to see if the Low Noise Amplifier (LNA) it uses would improve LoRa reception so that packets could be received at longer distances. The results of the tests indicated a small improvement.
In Part 1 I used a very simple technique of significantly reducing the transmitters radiated power so that range was cut to 50M or so. Its then fairly easy to compare reception distances both with and without an amplifier or to compare different antennas.
Simplify link performance testing
There is however a way of measuring the performance of link hardware, and distances that could be achieved, but without actually changing the distance between transmitter and receiver.
The transmit power level on the LoRa devices can be changed in steps of 1dBm. Thus if we adjust the transmit power, typically starting at a high level and reducing down in 1dBm steps, then when reception stops because the signals are now too weak for the receiver we have worked out how much transmit power is needed for that link. If we then change antennas, or add a receiver amplifier, then carry out the test again we can measure the change in performance of the link. If by changing an antenna we can now receive signals 6dBm weaker, then the antenna in normal use should increase reception range\distance by a factor of 2.
This might all sound a bit long winded, but using a descending power transmitter is a very practical simple and quick method of establishing the real world performance differences between antennas, LoRa modem settings and indeed amplifiers. All you need is a couple of Arduinos, LoRa modules and some suitable software.
A practical example - simulate long distance reception
As an example I decided to simulate a situation whereby the transmitter would behave as if it was at a great distance away and the receiver was indoors on my bench, a normal set-up for some perhaps. Having the receiver on the bench makes logging reception details quite easy as you can log reception data via the Serial monitor.
I adapted some of the SX127xx-LoRa library programs from here;
To operate on a pair of the LilyGo T3 V1.6.1 ESP32 SX1278 boards;
One board would be the transmitter and the other the receiver. These Lilygo boards can take an SD card so you could log the received packets details, RSSI and SNR etc to a file for later analysis.
The two programs I developed were 10_LoRa_Link_Test_Transmitter and 11_LoRa_Link_Test_Receiver. The working copies of these programs for the Lilygo are to be found in the LilyGo_T3_V1_6_1_ESP32_SX1278 folder of this Github repository;
LoRa parameters were initially set for SF7, bandwith 500Khz, coding rate 4:5, frequency 434Mhz. The transmitted packet is a bit of ASCII that looks like this;
T*1+03
Which translates to;
T = Test packet
* = Broadcast
1 = Transmitter node 1
+03 = 3dBm packet.
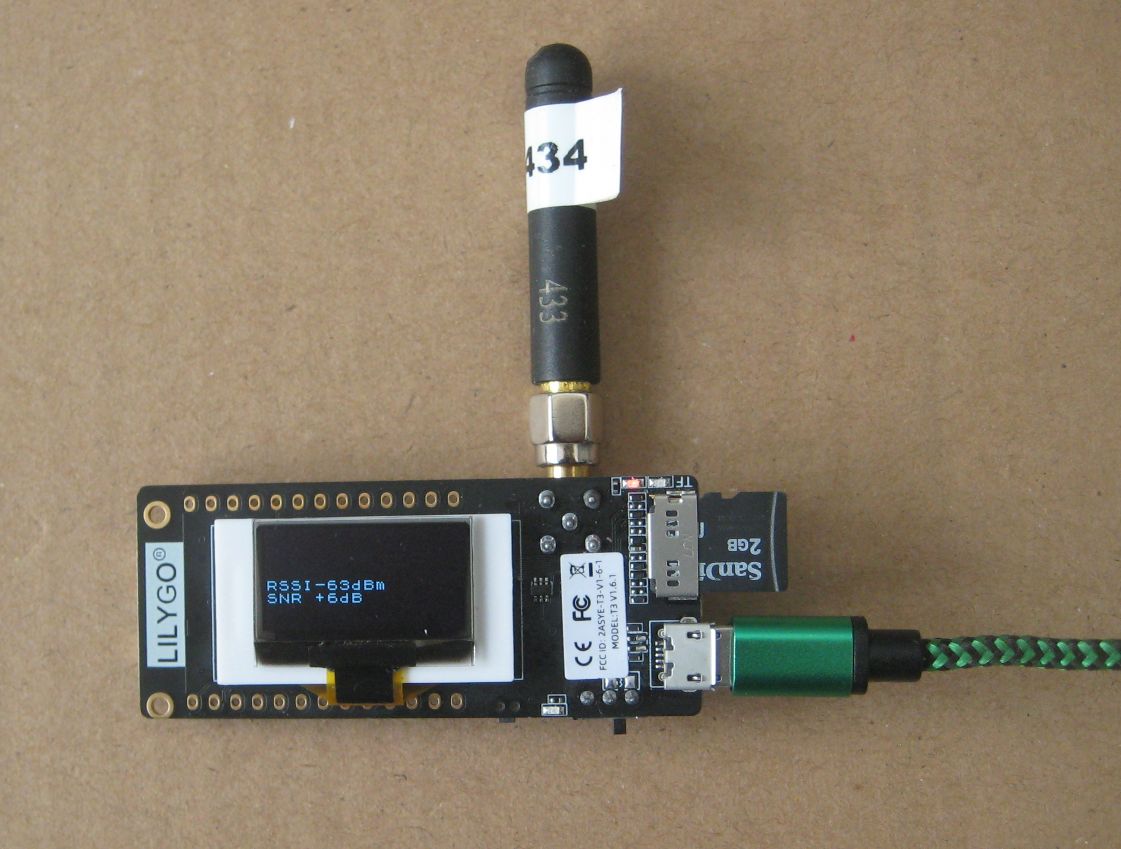
The LilyGo T3 V1.6.1 boards have an OLED and the original programs were changed to display the ASCII of the packet being sent and received on the respective OLEDs. Since you can see on the OLED the ASCII of the packet received you can tell the power level that was used to transmit it and this can be enough to carry out link testing. For instance if you are some distance from the transmitter, you may only be receiving the 5dBm or higher power transmitted packets. If you then change the antenna you can quickly see if you are able to receive weaker transmitted signals.
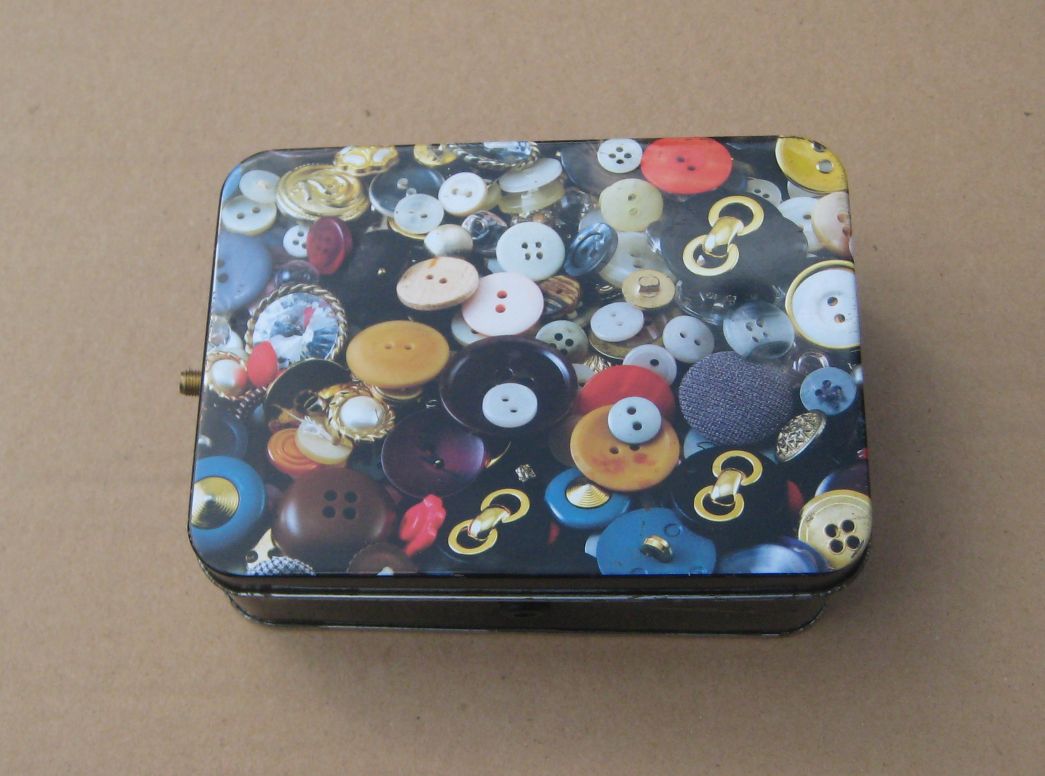
The antenna for the receiver was taped to a cardboard box on my work bench of my shed. The antenna was secured like this so I could be sure it was in the same location when directly connected to the LilyGo T3 V1.6.1 and then via a short cable when the AB-IOT-433 was in series with the antenna.
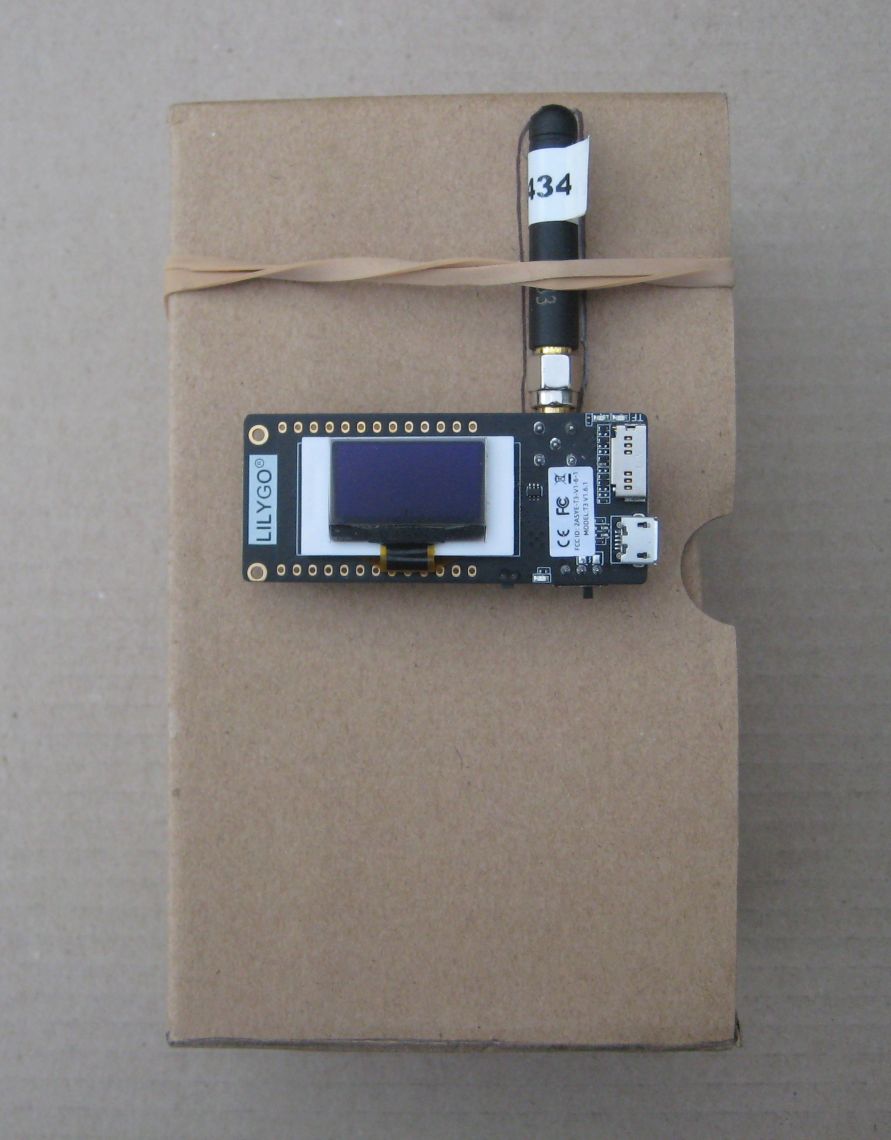
![]()
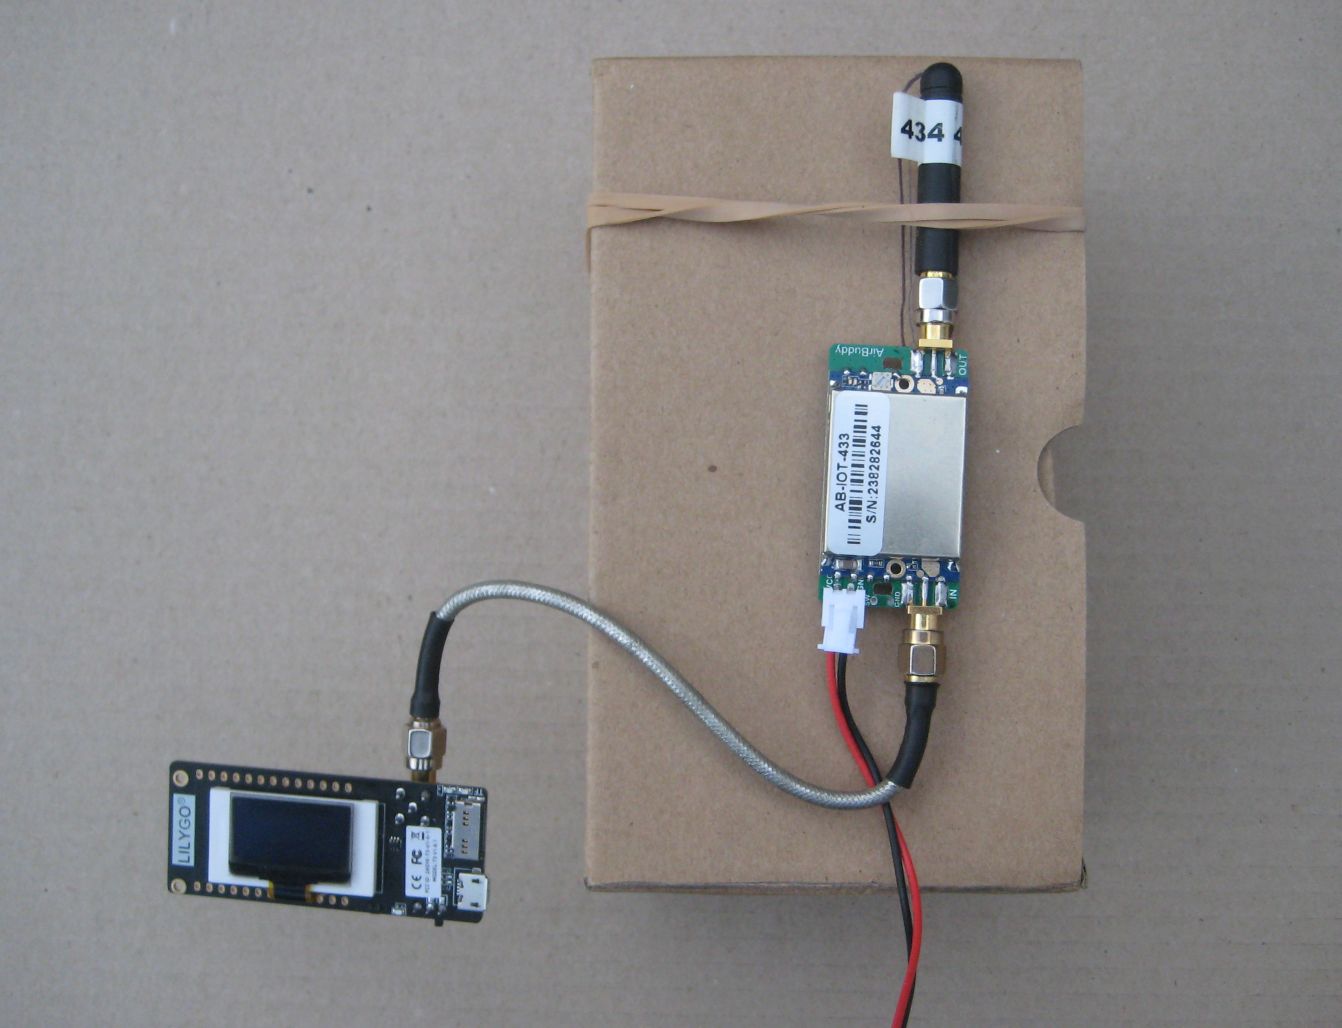
Now, in an ideal world I would place the transmitter many kilometres away so the arriving signals were very weak but that’s often not practical. So we need another way of making the transmitted packets very weak. There are a few ways of doing this, one I often use is to fit a 50ohm terminator to the transmit antennas socket like this;
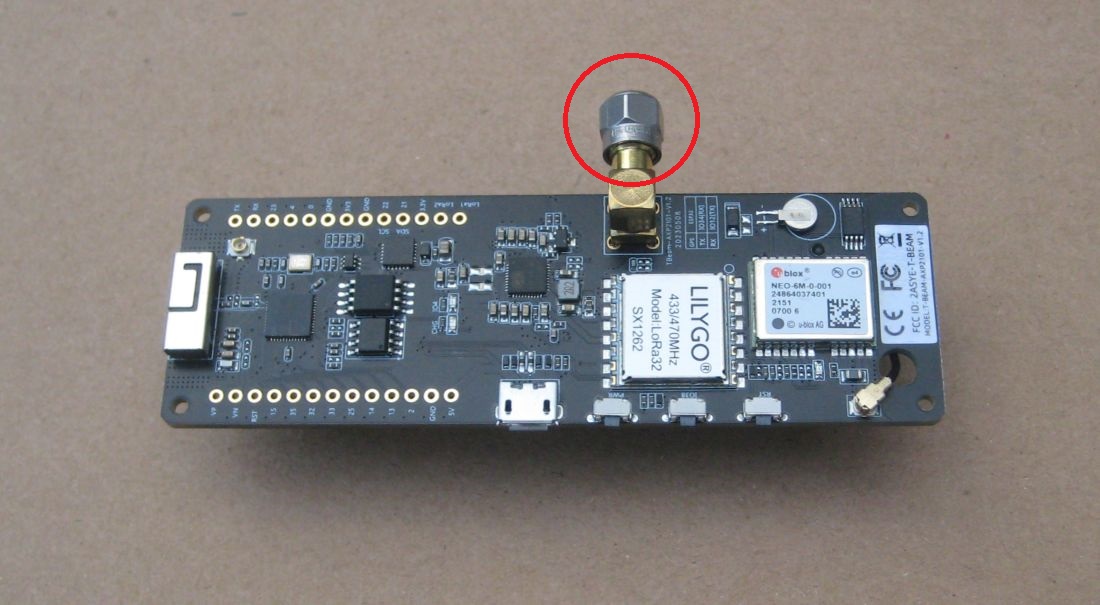
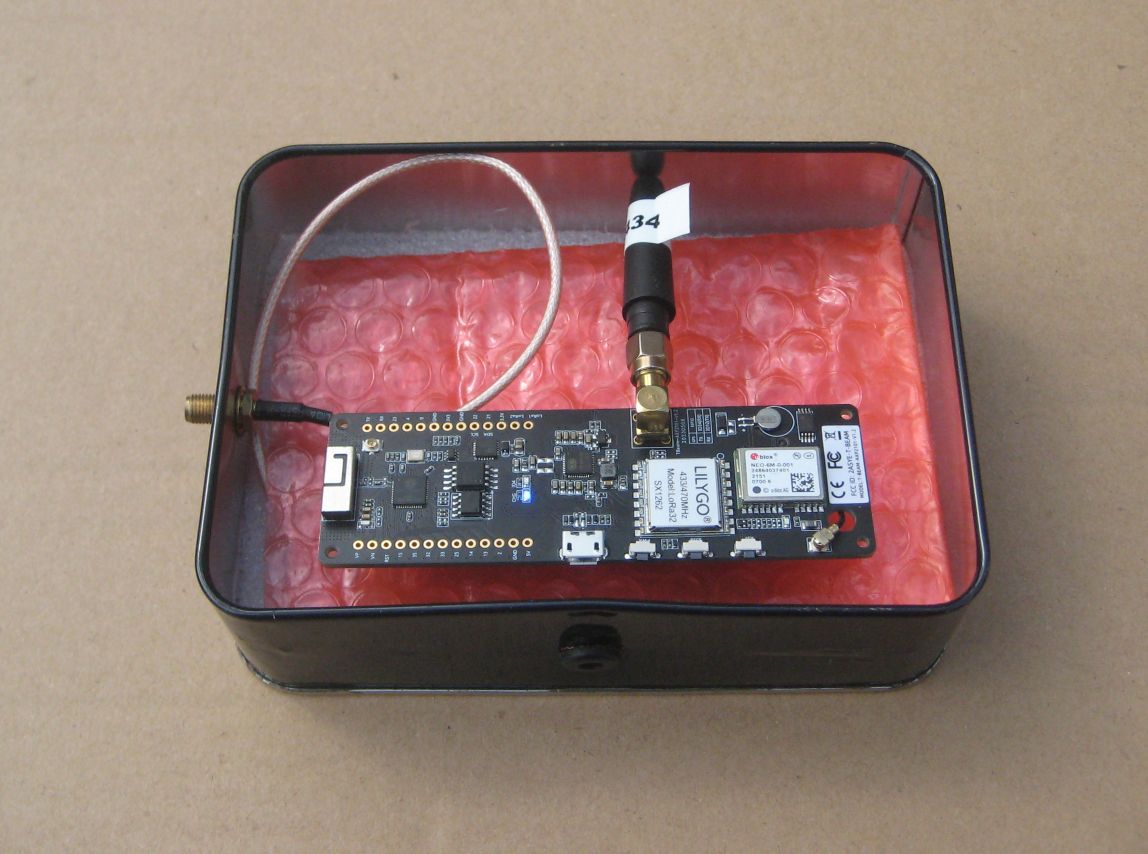
This will significantly weaken the emitted LoRa transmission and thus simulate transmission from a long distance. Another way is to put the transmitter in a tin, you can adjust the emitted signal level by moving the lid open or closed.
![]()
The logger receiver program, 11_LoRa_Link_Test_Receiver, logs packet data, if fitted, to an SD card in this form;
19s,T*1+17,RSSI,-109dBm,SNR,-4dB,Length,6,Packets,5,Errors,1,IRQreg,50,FreqErrror,-4328hz
20s,T*1+16,RSSI,-110dBm,SNR,-4dB,Length,6,Packets,6,Errors,1,IRQreg,50,FreqErrror,-4328hz
21s,T*1+15,RSSI,-110dBm,SNR,-4dB,Length,6,Packets,7,Errors,1,IRQreg,50,FreqErrror,-4194hz
22s,T*1+14,RSSI,-110dBm,SNR,-5dB,Length,6,Packets,8,Errors,1,IRQreg,50,FreqErrror,-4261hz
24s,T*1+13,RSSI,-114dBm,SNR,-5dB,Length,6,Packets,9,Errors,1,IRQreg,50,FreqErrror,-4462hz
Note the use of commas, its to make the file into a CSV type. The reception can be left to run for a while and the end file can then be loaded into a spreadsheet program, I use LibreOffice. With a bit of editing you can then sort the file into a list that shows how many 10dBm, 9dBm, 8dBm etc packets have been received. Thus from the sorted list you can get a good idea when reception stops and the RSSI and SNR readings when this occurs.
If you don’t have an SD card fitted, don’t worry, the same data is logged to the serial monitor which you can capture to a file with a serial terminal program such as Teraterm. The logging looks like this;
37s,T*1+17,RSSI,-102dBm,SNR,3dB,Length,6,Packets,28,Errors,1
38s,T*1+16,RSSI,-104dBm,SNR,3dB,Length,6,Packets,29,Errors,1
39s,T*1+15,RSSI,-104dBm,SNR,2dB,Length,6,Packets,30,Errors,1
40s,T*1+14,RSSI,-105dBm,SNR,2dB,Length,6,Packets,31,Errors,1
41s,T*1+13,RSSI,-106dBm,SNR,1dB,Length,6,Packets,32,Errors,1
I ran the logger for several minutes with the antenna directly connected to the LilyGo T3 V2.1.6. The log file was being saved in CSV format so I loaded it into LibreOffice as a CSV file. Delete the top few rows, and the seconds in the first column. Then select the entire block of data and use the spreadsheet menus to ‘Sort’ the data block in descending order based on the power level packet contents. The top of the block looks like this;
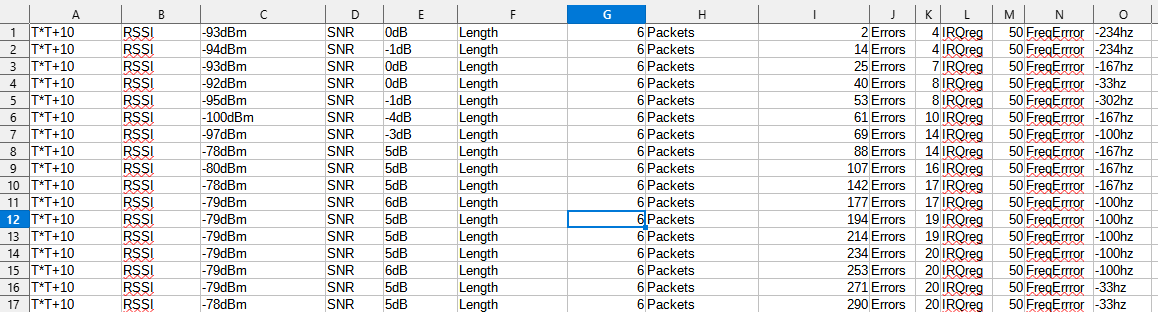
And the text of the file is this at the top;
T*T+10,RSSI,-93dBm,SNR,0dB,Length,6,Packets,2,Errors,4,IRQreg,50,FreqErrror,-234hz
T*T+10,RSSI,-94dBm,SNR,-1dB,Length,6,Packets,14,Errors,4,IRQreg,50,FreqErrror,-234hz
T*T+10,RSSI,-93dBm,SNR,0dB,Length,6,Packets,25,Errors,7,IRQreg,50,FreqErrror,-167hz
T*T+10,RSSI,-92dBm,SNR,0dB,Length,6,Packets,40,Errors,8,IRQreg,50,FreqErrror,-33hz
The bottom of the file is the interesting bit, it has the details of the weakest packets received;
T*1+09,RSSI,-117dBm,SNR,-8dB,Length,6,Packets,31,Errors,9,IRQreg,50,FreqErrror,-3993hz
T*1+09,RSSI,-115dBm,SNR,-8dB,Length,6,Packets,41,Errors,10,IRQreg,50,FreqErrror,-4328hz
T*1+09,RSSI,-119dBm,SNR,-9dB,Length,6,Packets,74,Errors,17,IRQreg,50,FreqErrror,-4060hz
T*1+09,RSSI,-117dBm,SNR,-9dB,Length,6,Packets,183,Errors,41,IRQreg,50,FreqErrror,-4127hz
T*1+09,RSSI,-116dBm,SNR,-10dB,Length,6,Packets,239,Errors,53,IRQreg,50,FreqErrror,-4261hz
T*1+08,RSSI,-117dBm,SNR,-8dB,Length,6,Packets,42,Errors,10,IRQreg,50,FreqErrror,-3926hz
PacketError,RSSI,-119dBm,SNR,-9dB,Length,6,Packets,3,Errors,1,IRQreg,70,,
PacketError,RSSI,-114dBm,SNR,-7dB,Length,6,Packets,10,Errors,2,IRQreg,70,,
PacketError,RSSI,-116dBm,SNR,-9dB,Length,6,Packets,12,Errors,3,IRQreg,70,,
PacketError,RSSI,-117dBm,SNR,-10dB,Length,6,Packets,12,Errors,4,IRQreg,70,,
PacketError,RSSI,-117dBm,SNR,-10dB,Length,6,Packets,12,Errors,5,IRQreg,70,,
In this case, without the LNA in series with the antenna the weakest packets received were 8dBm at an RSSI of circa -117dBm and SNR of -8dB.
I then repeated the test but with the amplifier in-line with the antenna. Looking at the weakest packets now received is interesting, with the amplifier there appears to be maybe a 1dBm reception improvement, but note the RSSI of the packets has improved, from circa -117dBm without the amplifier to -100dBm with the amplifier.
T*1+08,RSSI,-103dBm,SNR,-10dB,Length,6,Packets,121,Errors,25,IRQreg,50,FreqErrror,-3926hz
T*1+08,RSSI,-101dBm,SNR,-9dB,Length,6,Packets,131,Errors,28,IRQreg,50,FreqErrror,-4127hz
T*1+08,RSSI,-104dBm,SNR,-9dB,Length,6,Packets,142,Errors,30,IRQreg,50,FreqErrror,-4060hz
T*1+08,RSSI,-102dBm,SNR,-9dB,Length,6,Packets,180,Errors,41,IRQreg,50,FreqErrror,-3791hz
T*1+07,RSSI,-102dBm,SNR,-9dB,Length,6,Packets,143,Errors,30,IRQreg,50,FreqErrror,-4060hz
PacketError,RSSI,-100dBm,SNR,-9dB,Length,6,Packets,1,Errors,2,IRQreg,70,
PacketError,RSSI,-104dBm,SNR,-10dB,Length,6,Packets,1,Errors,3,IRQreg,70,,
PacketError,RSSI,-101dBm,SNR,-10dB,Length,6,Packets,1,Errors,4,IRQreg,70,,
So whilst the AB-IOT-433 is increasing the received signal level, the SNR of the signal is not improving and the much weaker packets are not received. There would be little or no range distance improvement when using it the LNA.
Longer range settings ?
These first tests were at SF7 bandwidth 500khz, would there be any significant improvement in the performance of the amplifier if we were using long range settings ? I decided to repeat the above test at SF12 and bandwidth 62.5Khz, a common set of long range settings for a 434Mhz LoRa device.
Using the same set-up as before I was now receiving the weakest of the packets sent down to 2dBm, so a direct comparison would be difficult. I needed to get the failure point back up to around 8dBm. I made some adjustments to the location of the transmitter(moved it further away) and changed the LoRa settings to SF12 bandwidth 62500Hz.
With no AB-IOT-433 in use the packets were received down to 7dBm, then with the AB-IOT-433 in place the packets were received down to 2dBm.
And wow ! Now were getting packets down to 2dBm, around a 5dBm improvement. So for the longer range LoRa settings the AB-IOT-433 could around double the reception distance.
Long distance range testing ……..
OK, so this article has mainly been about simple way of simulating long range LoRa communications and having a simple ways of an amplifier or indeed different antennas.
Sometimes, however, you may need to get test the range\distance performance in an actual long range application. In the early days of LoRa, circa 2014, I used the descending power methodology described in this article to test LoRa over a hilltop to hilltop 40km link. I wanted to know how much RF power would be needed to cover the 40km using simple antennas, there was at the time the possibility that LoRa might be good for a satellite application.
Similar descending power software to that described above was used to carry out the test over the 40km link. To reduce the impact of ground effects the transmitter and receiver were held above the ground on long 6M fibreglass poles. The transmitter started sending packets at 20dBm then reduced power in 1dBm steps all the way down to 2dBm, the lowest power level for a SX1278.
With the receiver on top of a long pole there was no chance of seeing a display to check what power level packets were being received so a simple beep\buzzer count was used. When the transmitter started the transmit loop at 20dBm sent out a specific start loop packet which the receiver (on top of the 6M pole) would detect and give a double beep which you could clearly hear on the ground. Then with a beep sound for each packet received all you needed to do was count the single beeps so you could work out at which transmit power reception stopped. 10 beeps heard would have meant the 11dBm packet had been received. So by a simple count of beeps you could work out how effective the link actually was.
In this particular case, way back in 2015, long range LoRa was pretty much unknown, and I was surprised back then that a mere 2dBm of transmit power was enough to cover the 40km with basic 1\4 wave wire antennas.
LoRa Calculator
To see the data sheet sensitivity specifications for a particular module you can use the on-line Semtech calculator;
https://www.semtech.com/design-support/lora-calculator